
Using measured data to calibrate and validate CEA

The reliability of models is closely connected to their capacity to reproduce a certain real-life phenomenon. Quite often models need inputs that range in a certain degree of uncertainty, either because the measurements of the inputs are not available or are not 100% reliable. The accuracy of outputs expected is highly dependent on the quality of inputs provided, therefore special care must be taken with uncertain parameters that have high influence on the result of the process (a.k.a. hyperparameters).
Measured data can be used to fine-tune those models, reducing the uncertainty of the inputs provided, in a procedure called calibration. Additionally, the difference of model outputs with corresponding measured data informs the accuracy of the model, in a procedure called validation. In this post we present how monthly data for 10 residential buildings in Singapore can be used to calibrate and validate the electricity demand of building energy models. The tool was created as a stand-alone CEA plugin and can be found on GitHub. If you would like to know more about how to create your own plugin and integrate with CEA, please check this blog post.
Installing the plugin
To install, clone this repo to a desired path (you would need to have git installed to run this command. Alternatively, you can also run this command in the CEA console, which comes with git pre-installed):
git clone https://github.com/architecture-building-systems/cea-plugin-template.git DESIRED_PATH
Open CEA console and enter the following command to install the plugin to CEA:
pip install -e PATH_OF_PLUGIN_FOLDER
(NOTE: PATH_OF_PLUGIN_FOLDER would be the DESIRED_PATH + 'cea-template-plugin')
In the CEA console, enter the following command to enable the plugin in CEA:
cea-config write --general:plugins cea_calibration.CalibrationPlugin
NOTE: If you are installing multiple plugins, add them as a comma separated list in the cea-config write --general:plugins ... command.
Preparing the Data
As preparation, the user needs to include in each evaluated scenario a new file that contains the measured metric to be compared (by default, energy demand measurements). The file must be stored in project/scenario/inputs/measurements/monthly_measurements.csv. It must contain the building name from CEA associated to this building, the ZIP code (optional, serving as the ID of the building outside CEA), monthly readings from JAN - DEC, and variable (by default, GRID_kWh is used, as it indicates the total energy consumption from the building). A sample input file is included.
If multiple scenarios are desired to be calibrated together, the scenarios have to be located within the same project folder. Otherwise, if the scenarios are meant to be calibrated separately, they have to be located in different project folders.
Validation
The validation script should be run after the script Building Energy Demand. It can be used to verify the accuracy of model outputs compared to monthly measurements. ASHRAE Guideline 14-2002 establishes two metrics of the accuracy of these models, which are also followed by the proposed script:
Normalized Mean Bias Error -- NMBE

NMBE.png
Coefficient of Variation of the Root Mean Squared Error --CV(RMSE)

CV_RMSE.png
Where:

The outputs of the validation script are:
NMBE and CV(RMSE) for each building
Number of calibrated buildings according to ASHRAE Guideline 14-2014
(-5% < NMBE < 5% and CV(RMSE) < 15%, for monthly calibrations)
Final score (used in the calibration script)
To test the validation script, we have analysed the results for 10residential buildings in Singapore, using the default archetypes builtfor multi-residential. The results for annual energy consumption arepresented in the following graph:

graph1.png
From the graphs, we can see modelled values are 3 to 4 times higher than what the measured values have indicated. None of the buildings are calibrated according to ASHRAE Guideline 14-2014. One possible reason is that such houses are part of the public housing scheme in Singapore, which have a lower energy use intensity than standard condominiums. Therefore, the multi-residential archetype may be a good starting point, but further adjustment in the model outputs is required to have a model more compatible with this typology. An automated optimization process is performed by the calibration script with that objective.
Calibration
The calibration script assists to find the optimal set of inputs that better converge the model to the corresponding the data. By testing many iterations of different combinations of input values, the algorithm informs which set is capable to inform the one in which the largest number of buildings is considered calibrated. The optimization algorithm uses as objective a score metric that consists of the summation of total energy consumption from calibrated buildings. This way, buildings that have higher energy consumption have a higher weight to be calibrated.
The optimization is based on Hyperopt, a Python library for serial and parallel optimization over awkward search spaces, which may include real-valued, discrete, and conditional dimensions. More details about it can be found at: https://github.com/hyperopt/hyperopt.
For every iteration, the calibration changes a set of parameters within a range pre-established by the user, calling CEA scripts to run schedules and demands, which is compared to measurements via the validation script. The calibration runs for the pre-determined number of iterations, generating a csv file in the project folder as output containing the tests of every iteration, and respective results obtained (calibrated buildings and score obtained).
The number of iterations required for convergence depends on the number of buildings analysed and complexity for optimization (as buildings with different energy patterns will diverge in terms of most suitable parameter). By default, the optimization is set to run for 100 iterations by the _max_evals_ parameter.
As a default, the script changes some variables to a fixed value (defined as _static_params_ in the script) and some values to be varied for each iteration (defined as _dynamic_params_ in the script). The user can access the code to changes values and ranges as suitable. For change of variables, further adaptations may be needed. Currently the parameters changed are:
Static parameters: Tcs_setb_C, void_deck, height_bg, floors_bg
Dynamic parameters: HS_ag, Tcs_set_C, Es, Ns, Occ_m2pax, Vww_lpdpax, Ea_Wm2, and El_Wm2
The full description of each parameter can be found in the CEA glossary.
Additionally, a seed parameter is created to generate variation of amongst the parameters chosen. By default, each parameter will vary up or down between a certain limit. This creates some variability between the inputs, as expected in real life for multiple buildings. The seed parameter is defined as a dynamic parameter and the variability (by default, 30%) is defined by the _Rand_it_ variable.
To test the calibration script, we have analysed the same 10 residential buildings in Singapore, aiming to increase their accuracy. The results of the calibration script can be obtained in the project folder and are indicated here (green indicates the best fit found during those iterations):
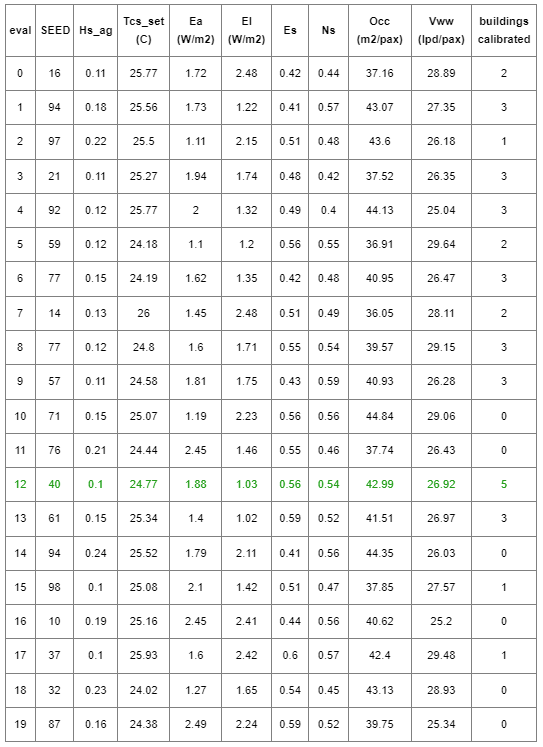
graph2.png
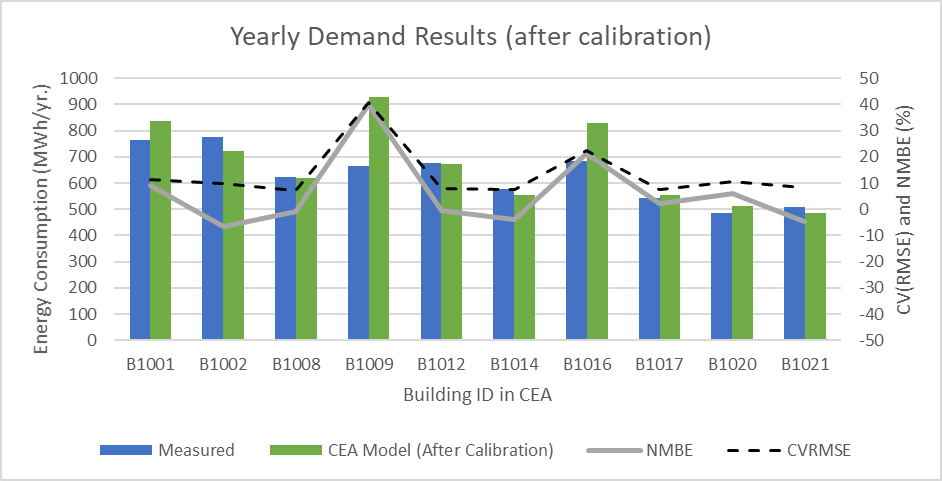
The results after calibration indicate a much better fit in relation to the data. 5 buildings are calibrated according to ASHRAE Guideline 14-2014 (-5% < NMBE < 5% and CV(RMSE) < 15%). All buildings indicate a better fit to the data compared to before. Only 2 buildings have errors above 10%, indicating that all other provide a good fit when compared to this dataset.We also compare the monthly results (measured data, prior calibration, and after calibration) for a single building (B1017), confirming the improvement of results:

graph3.png
We hope the provided script supports building energy simulation by evaluating the error of the models and increasing their accuracy. If there are questions regarding the code, or you are willing to support its expansion, feel free to contact: luis.santos@tum-create.edu.sg
Additional Remarks
After running the calibration, the inputs and outputs of CEA will be the ones for last iteration of the optimization, not necessarily the best one.
Ideally, the validation should be run in a separated dataset from the calibrated one, to avoid over-fitting of the data. The example shown in this post was just an example to illustrate the potential of both tools.
Buildings can have substantial difference in respect to their energy performance. For large number of buildings, it is likely that there is no single set of parameters that is able to validate all in a single process.