
Speeding up geospatial data collection with CEA: Part 3/3
This is the final part of a series of posts dedicated to describe the Data Management tools of CEA.
Back in Part 1, I described how to gather geospatial data about technology and economics with the Data Helper tool. Then, in Part 2, I described how to gather geometry data about buildings and their terrain with the District Helper tool and the Terrain Helper tool.
In this post I will talk about the new Streets Helper tool. This is a tool that can help you to extract the geometry of streets for virtually any location around the world.
The Streets Helper tool
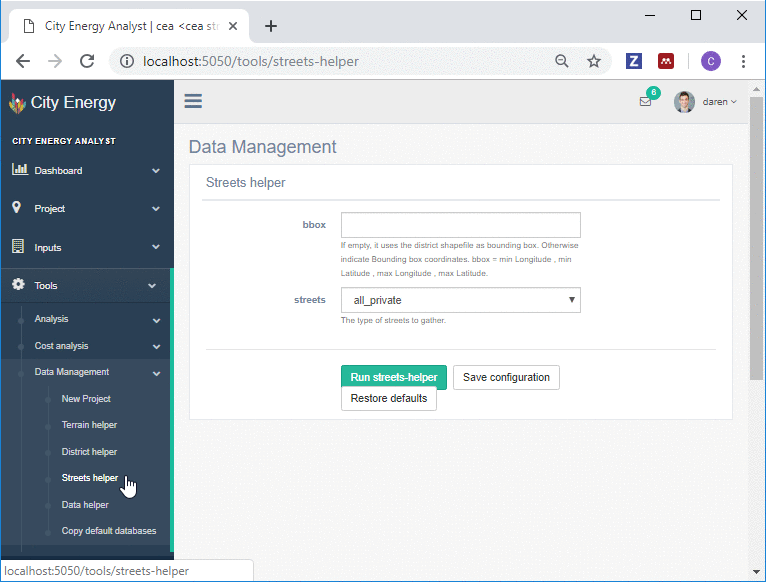
The Streets Helper tool retrieves GIS information about the street network of your zone of analysis in CEA. If you have not created your zone of analysis yet, I recommend you follow this tutorial, which describes how to create a new project in CEA and add your zone of analysis.
View fullsize

Blue: Zone of analysis in CEA, Red: District or geometry of surrounding buildings in CEA, Grey: Digital Elevation Model of the terrain, Green (RESULT): street network
The street network is a quite important database. It is used to determine the best route of underground electrical and thermal networks in CEA.
The Street Helper tool is quite flexible. It can help you to extract streets for any geographic extent you prefer and for any type of streets available.
The data is gathered from Open Street Maps, so make sure you are connected to the internet when running the Streets Helper tool.
gif streets helper tool.gif
To use the tool, we will use the next few steps:
Select a bbox: For this exercise we leave the bbox (bounding box) field empty. This will indicate CEA to use the extent of your GIS data to extract streets from OpenStreetMaps. Alternatively, you can indicate the coordinates where to extract the streets from.
Select a street type: For this exercise we will select ‘all_private’. I recommend this, since the other options ‘bike’, ‘drive’, ‘drive_service’, ‘all’ might be just too limited for the type of analysis we can do with CEA.
Run the CEA Streets Helper tool, and close the output messages screen once finished.
We can use either CEA or any other GIS system to visualize the results.

Blue: Zone of analysis in CEA, Red: District or geometry of surrounding buildings in CEA, Grey: Digital Elevation Model of the terrain, Green (RESULT): street network
…and that’s it. Now you know how to get a completely clean version of the street network for your case study.
Summary
During this 3-part series of posts I have described how to interact with the Data Management tools of CEA.
In Part 1, I described how to gather geospatial data about technology and economics with the Data Helper tool.
Later on, in Part 2, I described how to gather geometry data about buildings and their terrain with the District Helper tool and the Terrain Helper tool.
In this part, I finally described how to gather the geometry of Street Networks with the Streets Helper tool.
Getting proficient to use all these four tools should take you less than one hour. Gathering the data to use them, should take you less than a week.
At the end you could reduce your data collection efforts from one year to a little bit more than a week of work. Basically, close to 98% of your time could be potentially saved!
Just try it and let me know how it goes :-)
About the author:

Co-inventor of the City Energy Analyst
Project leader at EBP Schweiz.
If you liked this post, please give it a like or share it. Thanks!