[cea-a-02] Trees…Do they matter?
Want to include trees in CEA simulations? CEA v3.36.0 has made it possible to take trees into account for CEA’s Solar radiation analysis. This lesson introduces this new CEA Feature named Tree helper.
This CEA Lesson is under the CEA Basic Module required by both the Designer Track and the Engineer Track.
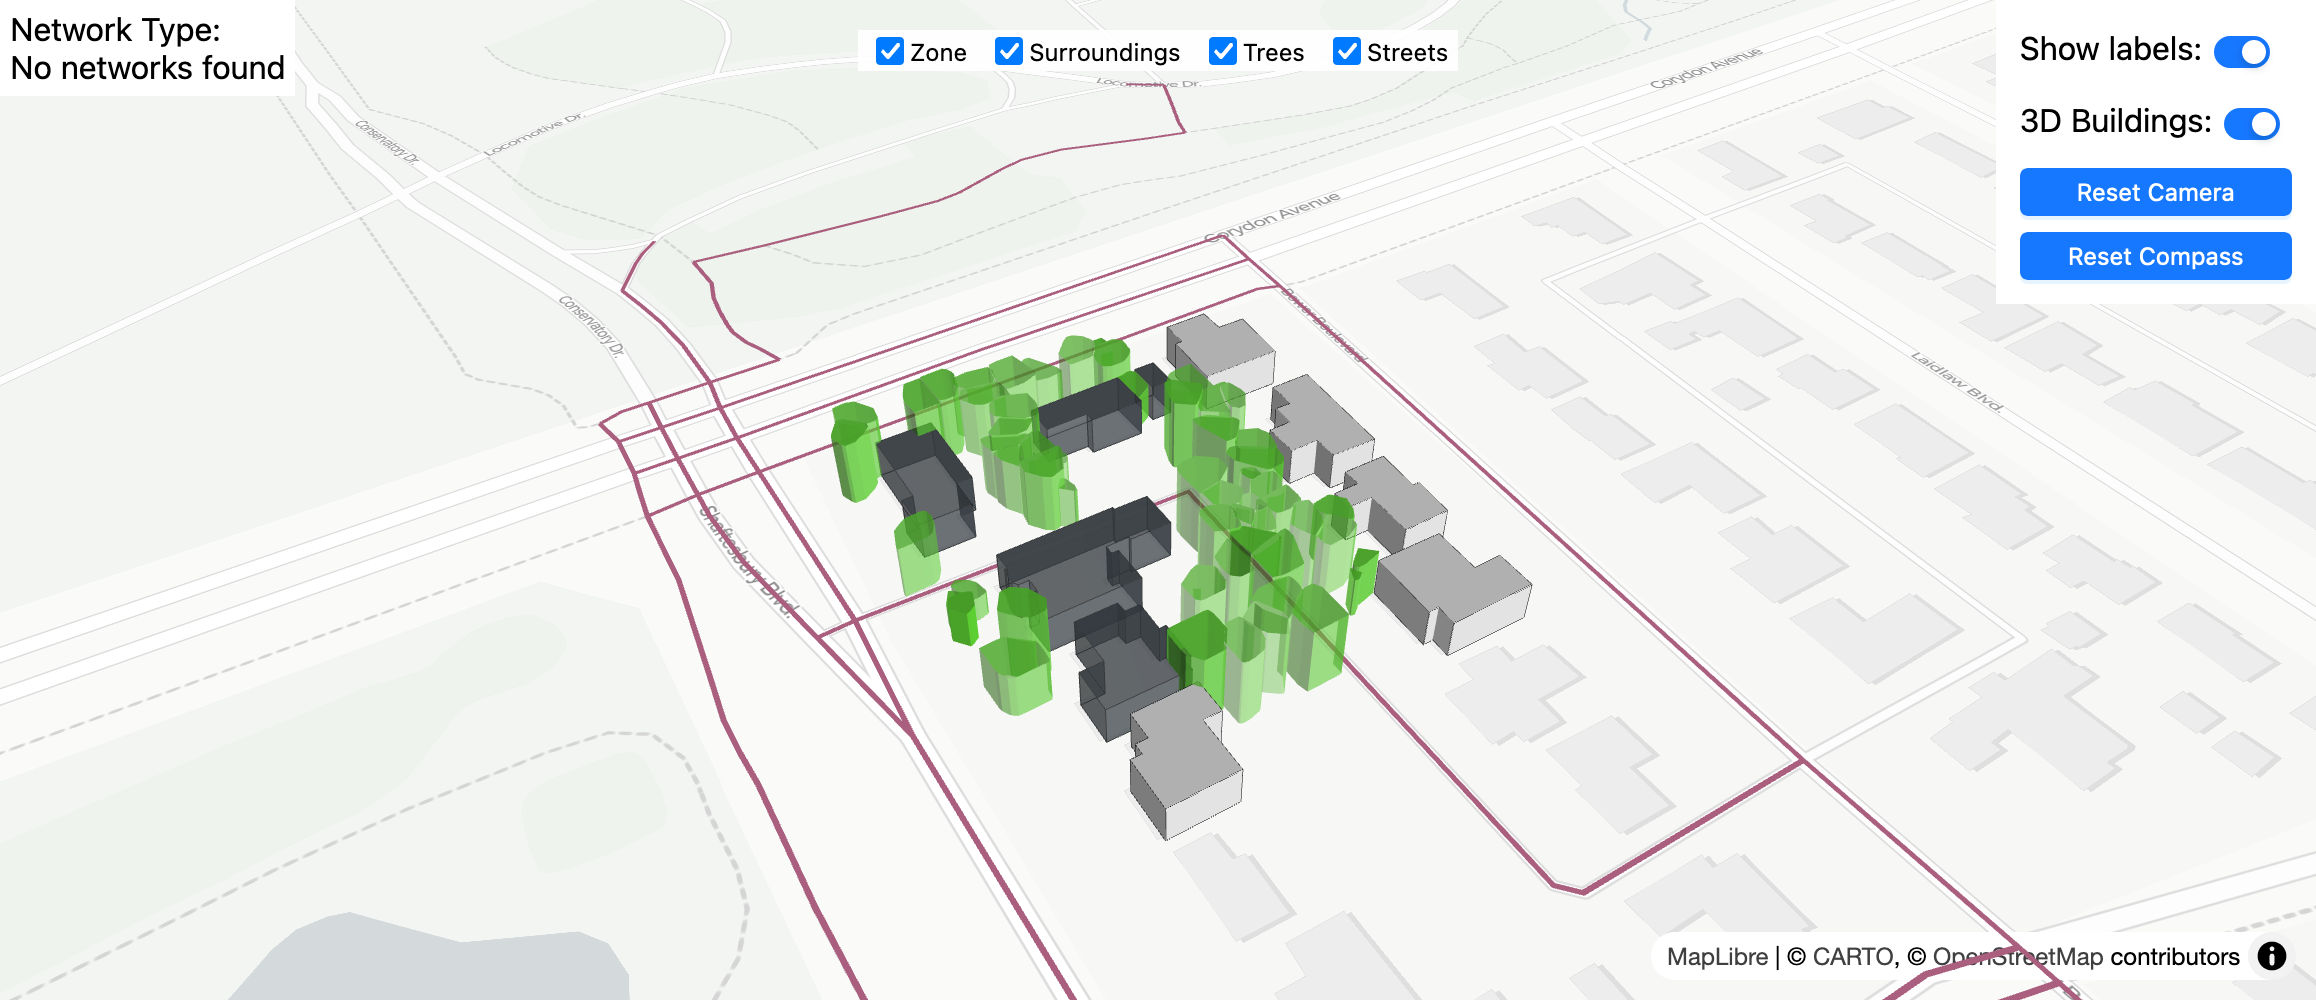
Fig.cea-a-02-01 presents a screenshot how trees an illustrated by CEA Dashboard’s Input editor. The location of these buildings and trees is at a residential area in the City of Winnipeg, Canada.
Before all, what-is-needed?
Before we proceed, pay attention to the following items.
Make sure you have CEA (Dashboard) v3.36.0 or later installed
Make sure you have the tree data available and I will explain the format below
Follow-next-steps
I assume you are quite familar with the family of Helpers in CEA’s Data Management tool box. Currently, Tree helper works in a similar way as Weather helper. Tree helper imports user-prepared tree data and processes the data for solar radiation analysis.
Step 1. Import the tree data
Launch CEA Dashboard;
Then, create a new Scenario;
Navigate to Tab Tree helper under Data Management Toolbox;
Link to your tree data in the ESRI ShapeFile polygon format and click Run Script.
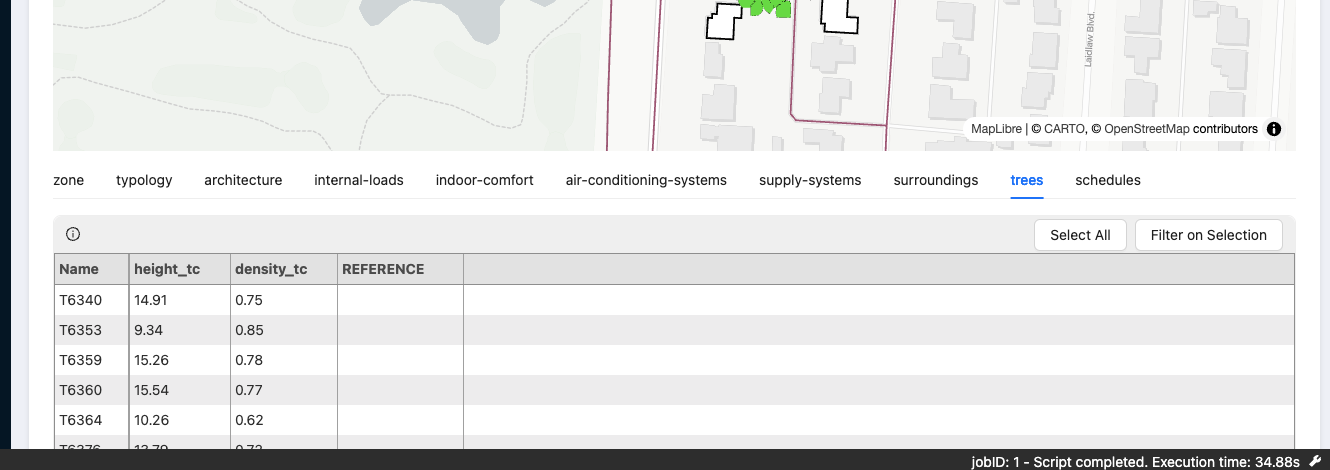
This step takes in the tree data and stores the data in the CEA Scenario. Your tree data should contain the outline of each tree’s canopy as a polygon and store the required tree’s parameters as shown in Fig.cea-a-02-02. The table contains three columns and all of them are necessary. Name is the unique tree ID, and I suggest to make it alphanumeric. density_tc means tree canopy density. It is the proportion of ground area covered by the vertical projection of tree canopies. It is a measure of how much of the sky is obscured by the canopy when viewed from below. density_tc ranges from 0 to 1. height_tc means the height from ground to the top point of the three canopy, and unit is metre.
You can download this exmaple CEA Scenario here.
Fig.cea-a-02-02 presents the attribute table of an example polygon ShapeFile imported into CEA with Tree helper.
Step 2. View and edit the trees
Navigate to Input editor;
View the trees and check if they are illustrated around your buildings as intended (See Fig.cea-a-02-01 as an example);
View, edit, or delete the tree parameters under Tab Trees;
By the way, the imported trees.shp is stored under Folder {Your Project} > {Your Scenario} > inputs > tree-geometry
If your Inpur editor is not showing anything, please check if your tree polygons are correctly geo-referenced.
Step 3. Execute Solar radiation analysis
Navigate to Tab Solar radiation under Demand forecasting Toolbox;
Click Run Script to start solar radiation analysis with the trees.
This step executes solar radiation analysis using Daysim. Currently, with CEA v3.36.0, CEA considers trees as objects similar to a building with transparency based on the Parameter density_tc. Hence, light penetrates the tree objects twice and the tree transparence equals the square root of density_tc. Also, please note that all trees are considered coniferous (evergreen). In future releases, we hope to include the deciduous option and consider the cooling effects of the trees in the local microclimate.
Do trees matter?
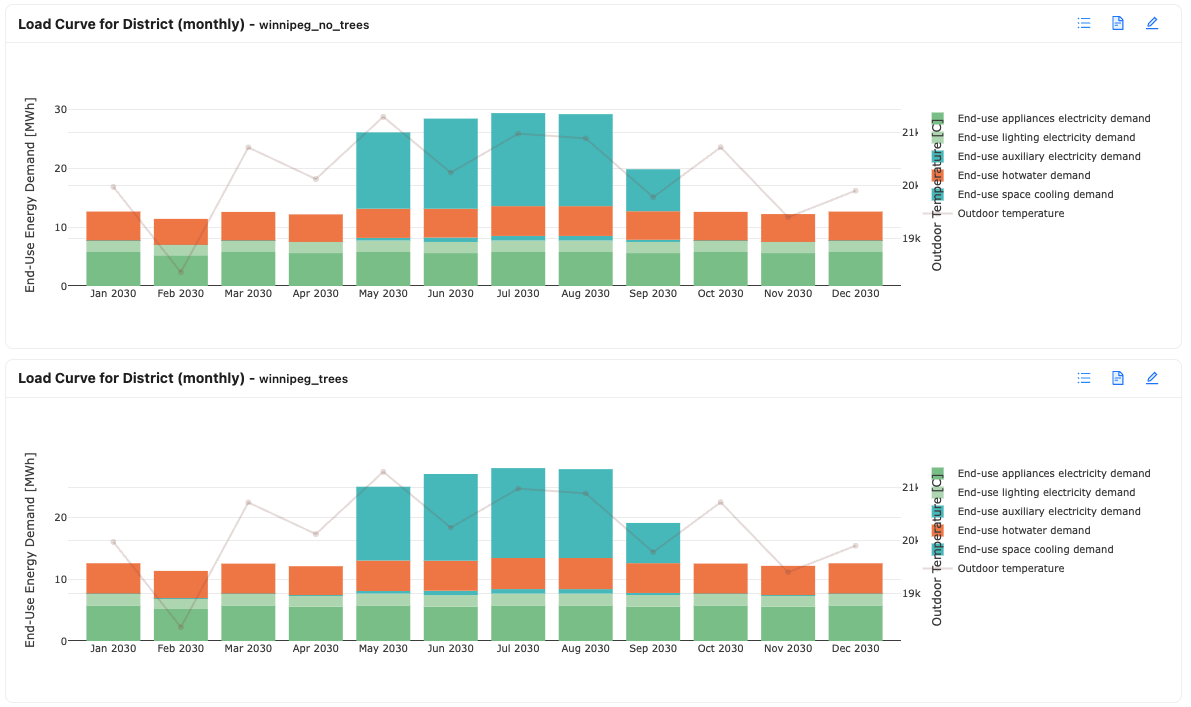
Now, back to the question at the beginning of this lesson. Do trees matter in urban building energy modelling? Using the above-mentioned residential area in Winnipeg, we compare the solar irradiation and energy demand in two scenarios (i.e. without and with trees) in Fig.cea-a-02-03 and Fig.cea-a-02-04. The impact of trees is rather obvious in such a case of low-carbon North American residential neighbourhoods with single-family houses.
This might not necessarily be the case in scenarios where building volumes are much larger than the tree canopies. Also, for the impact of trees on PV electricity yields, you may want to check this article published in 2023 titled “Do we need a saw? Carbon-based analysis of facade BIPV performance under partial shading from nearby trees“.
In case you wonder why there is significant space cooling demand in Winnipeg, Canada. This is because we applied the Singapore weather file in the simulation. : D
Fig.cea-a-02-03 presents the monthly solar irradtion on each building surface for the two CEA scenarios of the Winnipeg example without (upper) and with (lower) trees.
Fig.cea-a-02-04 presents the monthly end-use energy demand for the two CEA scenarios of the Winnipeg example without (upper) and with (lower) trees.
Questions?
Encountering difficulties or having questions about the processes above? Proceed to the CEA Forum to post your questions. Your questions may be universal and can benefit other CEA users. Please include the Lesson Code [cea-a-02] when posting your question.


