
Speeding up geospatial data collection with CEA: Part 1/3
Collecting geospatial data about the built environment and energy infrastructure is perhaps one of the most tedious processes existing out-there.
Besides access privileges, collecting these data requires access to information about buildings, users, topography, street patterns, technology and economics.
This information can easily amount to thousands of data points for a single Neighborhood or District.
I have noticed that people spend an entire year collecting these data before doing any meaningful analysis.
In response to this, the CEA team has created an extraordinary new set of tools to finish this process in just few days.
They call these the Data Management tools of CEA:
Data Helper tool.
District Helper tool.
Terrain Helper tool.
Streets Helper tool.
This article is Part 1 of a series of blogs dedicated to describe the Data Management tools of CEA.
Let’s start by talking about the Data Helper tool as follows:
The Data Helper tool
One of the coolest features of CEA is that you can easily use CEA’s own open source databases to automatically obtain attributes about buildings in locations representative of Europe (Switzerland) and South-east Asia (Singapore).
These attributes include data about typical architectural features, building occupancy patterns, techno-economics of energy technology, and data about emissions and primary energy consumption of fuels. These data amounts to more than 250 variables and 17 different databases.
View fullsize
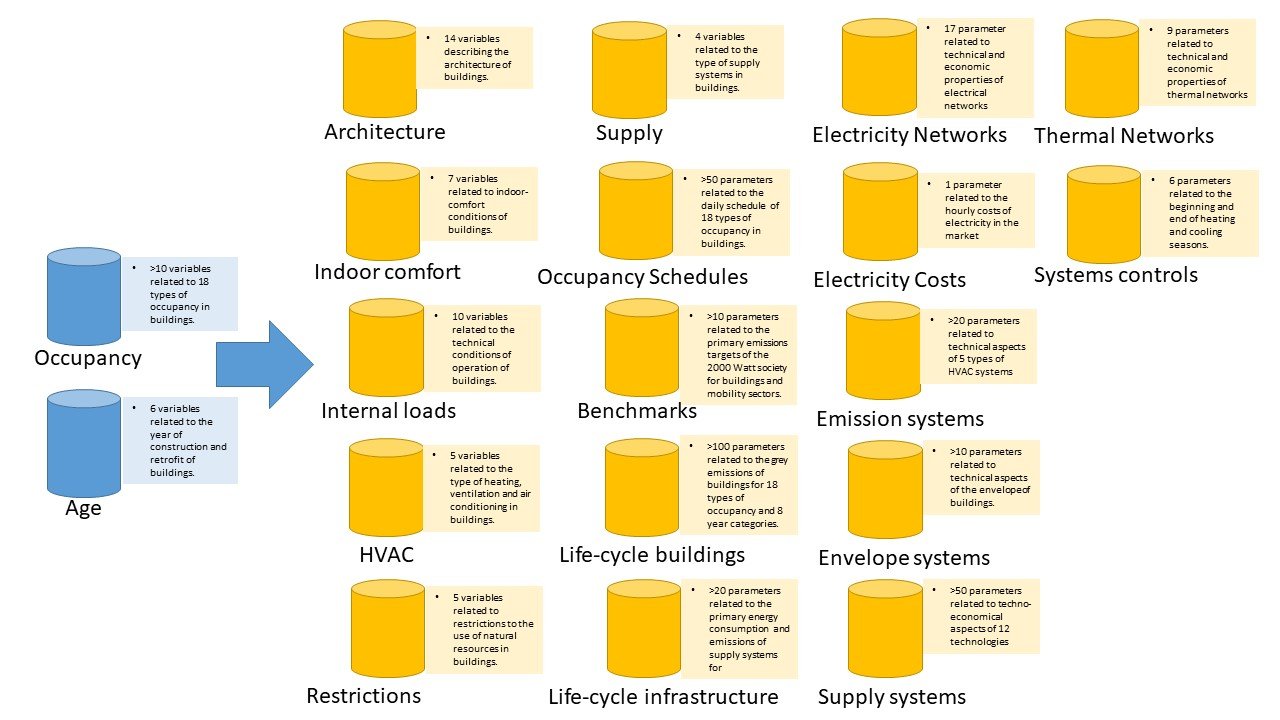
Blue: input databases, Yellow (RESULT): >250 variables and 17 databases.
We have collected these data from the best standards, research and work in the field. It may not be 100% representative of every building in your case study, but it is a great point to start from.
In most of our case studies with CEA, these data is quite sufficient, if not already extensive. I advise to use these data to better understand how your building stock performs. Then, decide whether more detailed information is needed or not.
To gather this data, The Data Helper tool makes a connection between the type of occupancy and age of buildings inside your zone of analysis. So you will need this information upfront to use the tool.
The Data Helper tool is quite flexible, so if you already have some of these data available, you can just create what you have missing.
To use the tool, you need to have created a New Project with CEA first. After that, you can follow the next steps:
Select a region: For this exercise we select ’CH’, which will use our database about Swiss constructions to gather data for your buildings.
Select a database: For this exercise we will select ‘comfort’, ‘architecture’, ‘HVAC’, ‘internal-loads’, ‘supply’, ‘restrictions’, ‘technology’. These parameters will indicate which databases to create.
Run the CEA Data Helper tool, and close the output messages screen once finished.
The results are stored in a series of databases in the inputs folder of your New project with CEA. Here is an example of one of the more than 250 variables we can gather with CEA.

Further Reading
If you would like to know more, here are a couple of articles that introduce the data used by the Data Helper tool.
Ong, B. L. (2019). Life Cycle Assessment of Building Integrated Photovoltaic (BIPV) system in urban high-rise buildings in Singapore. Master thesis. Technical University of Berlin.
Fonseca J. A., and Schlueter A. (2015). Integrated model for characterization of spatiotemporal building energy consumption patterns in neighborhoods and city districts. Applied Energy, 142, 247–265.
Thoma, E., Fonseca, J. A., & Schlueter, A. (2014). Estimation of base-values for Grey Energy, Primary Energy, Global Warming Potential (GWP 100A) and Umweltbelastungspunkte (UBP 2006) for Swiss constructions from before 1920 until today. In DAKAM (Ed.), Contemporary Urban Issues ’14 (p. 17). Istanbul.
About the author:

Co-inventor of the City Energy Analyst
Project leader at EBP Schweiz.