
GUIDEBOOK · CEA-4 APP TRAINING
LCA Part 2a: GHG Emissions
LCA Part 2a: GHG Emissions
Overview
Calculates greenhouse gas emissions for each building and district plant across the full building lifecycle. Produces both lifecycle emissions (embodied + operational over the building’s lifespan) and operational emissions (hourly emissions from energy system operation).
What It Calculates
Embodied (Production) Emissions (kgCO2e):
- Building envelope construction (walls, roof, floor, windows)
- Technical systems (HVAC equipment)
- PV/PVT/SC panel manufacturing (if configured)
Operational Emissions (kgCO2e):
- Per energy carrier (grid electricity, natural gas, oil, coal, wood)
- Per service (space heating, space cooling, DHW, electricity)
- District heating and district cooling (including pumping)
- Hourly timesteps (8,760 hours)
Biogenic Carbon (kgCO2e, negative):
- Carbon stored in timber and bio-based building materials
Demolition Emissions (kgCO2e):
- End-of-life processing at the building’s demolition year
Maintenance and Repair Emissions (kgCO2e):
- Estimated as a fraction of production emissions, not modelled from a schedule
- Charged once per installed generation, on each component’s own replacement cycle
Solar Offset Emissions (kgCO2e, negative):
- Grid emissions avoided by on-site PV/PVT/SC generation
Lifecycle Timeline:
- Year-by-year emissions from construction year through demolition
- Supports grid decarbonisation projections
Scope: which lifecycle stages are included
CEA reports against the EN 15978 lifecycle module framework. Knowing which modules are covered matters when comparing CEA results with a whole-life carbon assessment produced elsewhere — a smaller CEA total may simply reflect a narrower boundary.
| Module | Stage | Covered | Notes |
|---|---|---|---|
| A1-A3 | Product (raw material, transport, manufacturing) | yes | The production category |
| A4 | Transport to site | no | Not modelled |
| A5 | Construction / installation | no | Not modelled |
| B1 | In-use emissions | no | Not modelled |
| B2 | Maintenance | estimated | Fraction of production — see below |
| B3 | Repair | estimated | Fraction of production — see below |
| B4 | Replacement | yes | Components renewed on their own service life |
| B5 | Refurbishment | partial | Via District Evolution Pathways |
| B6 | Operational energy | yes | The operation category, hourly |
| B7 | Operational water | no | Not modelled |
| C1 | Deconstruction | no | Not modelled |
| C2-C4 | Transport, waste processing, disposal | yes | The demolition category |
| D | Beyond the system boundary | no | Not modelled |
Two points worth reading carefully:
demolition is C2-C4, not C1. The underlying material data covers transport, waste
processing and disposal, but not the energy of deconstruction itself. The category name is
broader than the modules behind it.
Maintenance (B2) and repair (B3) are estimates, not simulations. CEA has no maintenance schedules, so both are taken as a proportion of production emissions, following RICS (2017) and as adopted by Singapore’s Green Mark Version 7 Cn Technical Guide (Table 16):
| Module | Default | Basis |
|---|---|---|
| B2 maintenance | 1% of production | RICS recommends 1% of A1-A5 |
| B3 repair | 10% of production | RICS recommends 10% of A1-A3 |
Both defaults are deliberately conservative. RICS states B2 against A1-A5, but CEA models only A1-A3, so the fraction is applied to a smaller base. Neither figure carries a frequency term, so CEA charges the allowance once per installed generation rather than annually.
Set either fraction to 0 to exclude that module entirely.
Prerequisites
- LCA Part 1: Energy by Carrier completed for the what-if scenario
- Solar radiation data (for PV-related embodied emissions)
- Zone geometry and building properties
Key Parameters
| Parameter | Description |
|---|---|
| What-if name | Which final-energy scenario to calculate emissions for |
| Year end | Last year of the emission timeline projection. Leave blank for 2100 |
| Grid decarbonisation reference year | Base year for grid emission factor (optional) |
| Grid decarbonisation target year | Target year for reduced grid emissions (optional) |
| Grid decarbonisation target emission factor | Target kgCO2/kWh at target year (optional) |
| Grid carbon intensity dataset CSV | External 8760-row hourly grid intensity file (optional) |
| CSV carbon intensity column name | Which column in that file holds the intensity, in gCO2e/kWh. Required whenever the CSV is given |
| Maintenance fraction of production | EN 15978 B2 as a share of production emissions (default 0.01; 0 excludes B2) |
| Repair fraction of production | EN 15978 B3 as a share of production emissions (default 0.10; 0 excludes B3) |
How to Use
-
Run LCA Part 1: Energy by Carrier first for the what-if scenario
-
Run LCA Part 2a: GHG Emissions:
- Navigate to Life Cycle Analysis (LCA)
- Select LCA Part 2a: GHG Emissions
- Select the what-if scenario
- Optionally configure grid decarbonisation trajectory
- Click Run
-
Processing time: 2-10 minutes for typical districts
Output Files
All outputs are under {scenario}/outputs/data/analysis/{what-if-name}/emissions/:
| File | Description |
|---|---|
emissions_buildings.csv | Per-entity lifecycle totals (production, operation, biogenic, demolition, maintenance, repair) |
emissions_operational.csv | District-level hourly operational emissions (8760 rows) |
emissions_timeline.csv | District-level yearly lifecycle timeline |
operational/{building}.csv | Per-building 8,760-row hourly operational emissions |
timeline/{building}.csv | Per-building yearly lifecycle timeline |
Understanding Results
- Buildings using DH/DC show zero operational emissions at building level; actual emissions appear on the plant row as district heating/cooling emissions
emissions_buildings.csvcontains lifecycle totals (operation column sums the full lifecycle, not a single year)- Timeline files show year-by-year breakdown, useful for tracking trajectories toward net-zero
- Grid decarbonisation linearly interpolates emission factors between reference and target years, reducing operational grid emissions over time
Troubleshooting
| Issue | Solution |
|---|---|
| Very high embodied emissions | Check material quantities in architecture file are realistic |
| Zero operational emissions | Ensure final-energy calculation completed; check supply systems are defined |
| Missing biogenic carbon | Verify timber content in architecture file; check database includes biogenic factors |
Plot - Lifecycle Emissions
Overview
Creates stacked bar charts showing total lifecycle emissions per building, combining embodied, operational, biogenic, demolition, and solar offset categories.
What It Shows
- Positive bars: operational emissions by service + embodied (production, demolition)
- Negative bars: biogenic carbon, PV/PVT/SC offsets
- Title includes the lifecycle year range (e.g. “CEA-4 Lifecycle Emissions (1926 - 2088)”)
- Net-zero buildings show positive and negative bars roughly equal
Key Parameters
| Parameter | Description | Options |
|---|---|---|
| What-if name | Which scenario(s) to plot | Multi-select |
| Y unit | Emission unit | kgCO2e, tCO2e |
| Normalise by | Normalisation | None, Gross floor area |
| Include | Entity filter | Buildings, Plants, or both |
Legend Labels
| Legend Name | Meaning |
|---|---|
| Electricity | Grid electricity operational emissions |
| Space Heating | Heating system operational emissions |
| Space Cooling | Cooling system operational emissions |
| Domestic Hot Water | DHW system operational emissions |
| District Heating | DH plant operational emissions (incl. pumping) |
| District Cooling | DC plant operational emissions (incl. pumping) |
| Production | Embodied construction emissions |
| Biogenic | Carbon stored in bio-based materials (negative) |
| Demolition | End-of-life emissions (EN 15978 C2-C4) |
| Maintenance | Estimated maintenance, a fraction of production (B2) |
| Repair | Estimated repair, a fraction of production (B3) |
| PV Offset | Grid emissions avoided by PV (negative) |
Plot - Emission Timeline
Overview
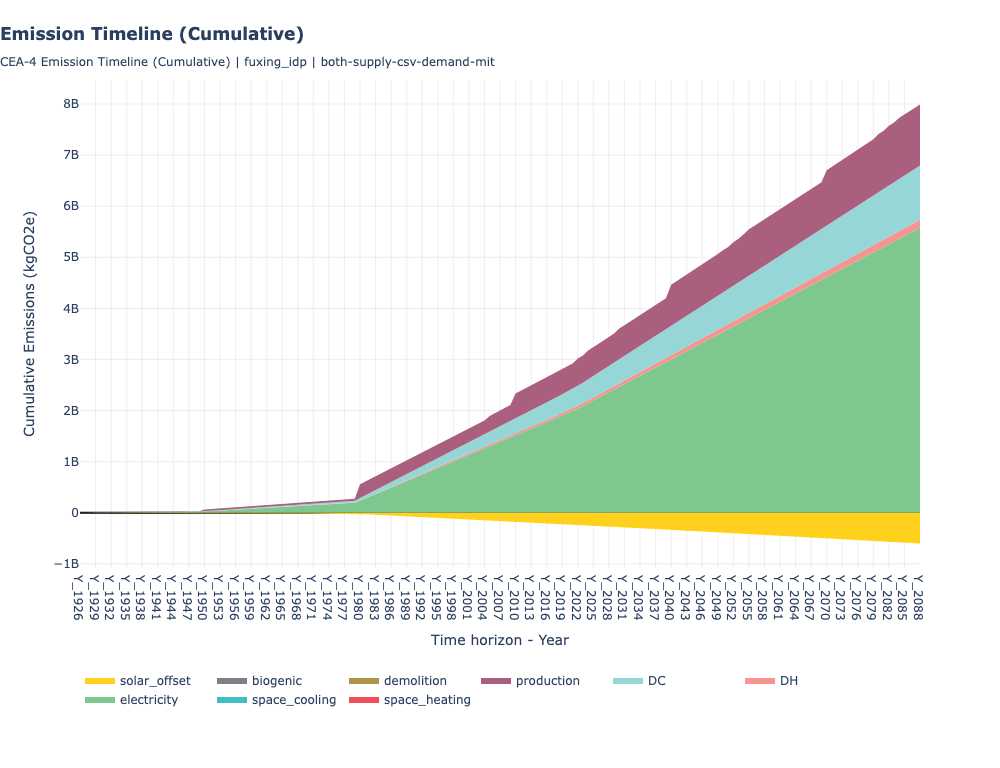
Visualises how cumulative emissions evolve over time across the district, tracking the trajectory from construction through demolition.
What It Shows
- Cumulative stacked area chart over the lifecycle year range
- Construction spikes (embodied), steady operational accumulation, demolition at end-of-life
Example
Cumulative emission timeline showing district emissions over the building lifecycle:
Key Parameters
| Parameter | Description | Options |
|---|---|---|
| What-if name | Which scenario to plot | Single select |
| Y unit | Emission unit | kgCO2e, tCO2e |
Plot - Operational Emissions
Overview
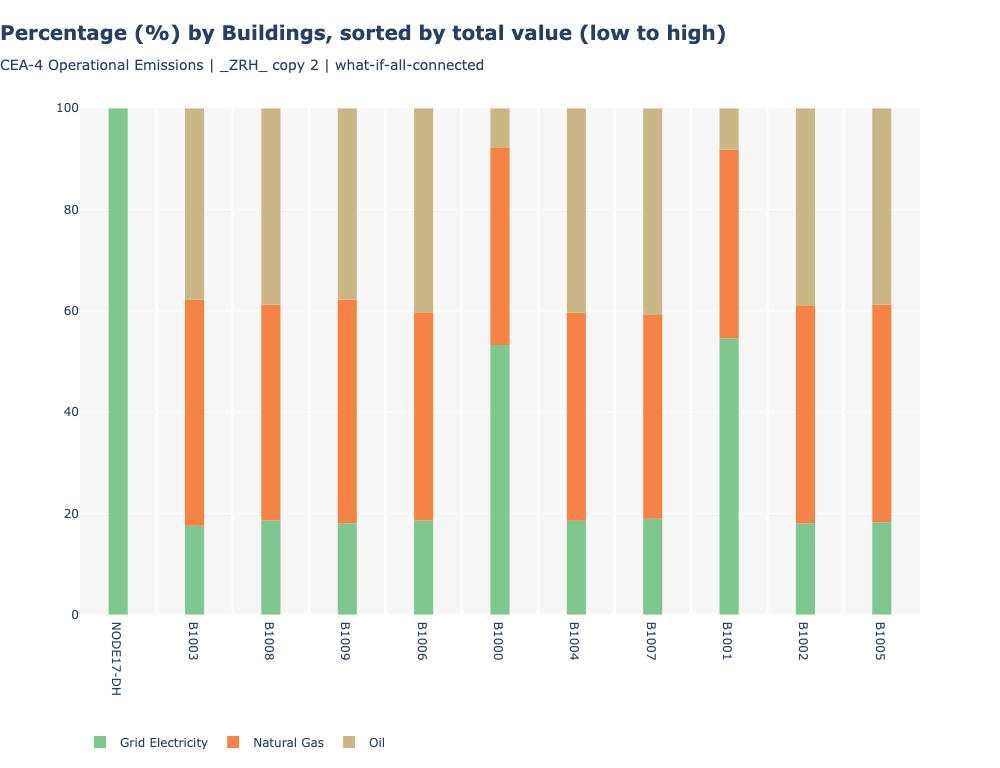
Creates bar charts of operational emissions from energy system operation, with breakdowns by service and/or energy carrier.
What It Shows
- Per-building operational emissions (annual or time-series)
- Breakdown by service or by carrier
- Solar offset emissions (shown as negative)
Example
Operational emissions by energy carrier (percentage breakdown per building):
Key Parameters
| Parameter | Description | Options |
|---|---|---|
| What-if name | Which scenario(s) to plot | Multi-select |
| Y category | Breakdown type | By operation (service), by energy carrier, or both |
| Y unit | Emission unit | kgCO2e, tCO2e |
| Normalise by | Normalisation | None, Gross floor area |
| X axis | View type | By building, by month, district hourly, etc. |
| Include | Entity filter | Buildings, Plants, or both |
Related Features
- LCA Part 1: Energy by Carrier - Prerequisite (must run first)
- LCA Part 2b: Costs - Economic analysis of the same what-if scenario
- LCA Part 2c: Heat Rejection - Environmental heat impact
- Visualisation - Additional plotting tools
<- Back: LCA Part 1: Energy by Carrier | Back to Index | Next: LCA Part 2b: Costs ->
Source: view raw on GitHub ↗