
Building-Integrated Agriculture (BIA): plot your BIA calendars and visualise your assessment outcome!
In the previous blogs, I have introduced the two functionalities of BIA assessment and BIA profiler. The former calculates the BIA metrics for your selected crop type. The latter creates the crop profile and the planting calendar for each building surface with a user-defined objective of BIA metrics. In this blog, I am going to introduce how to plot the planting calendars. This blog includes four sections to introduce the tool’s installation, input preparation, and how to execute the BIA plotter and understand the results.
Installation
The installation is almost the same as for installing the BIA assessment. Before all, please make sure you have successfully installed the City Energy Analyst (CEA). Please follow the next steps to install all three functionalities of the BIA tool: BIA Assessment, BIA Profiler and BIA Plotter.
Open Terminal (For Windows, please open CEA console)
Type, then press return: cd documents/github
Type, then press return: git clone https://github.com/shizhongming/cea-plugin-bia.git
Type, then press return: cd cityenergyanalyst
Type, then press return: conda activate cea
Type, then press return: pip install -e /Users/your_name/Documents/GitHub/cea-plugin-bia
Type, then press return: cea-config write --general:plugins bia.bia_assessment.BiaAssessmentPlugin
Type, then press return: cea-config write --general:plugins bia.bia_profiler.BiaProfilerPlugin
Type, then press return: cea-config write --general:plugins bia.bia_plotter.BiaPlotterPlugin
At this point, if no error is reported, then you have successfully finished the installation. You should be able to see the BIA tab in the CEA Dashboard: Tools > Urban Agriculture > BIA Assessment, BIA Profiler and BIA Plotter.
When executing the last two steps, If you encounter an error that looks like “ValueError: Plugin tried to redefine config section agriculture”, please delete /Users/your_name/cea.config, and then retry the last step mentioned above.
Input preparation
Please make sure you have executed the following CEA commands in the CEA Dashboard. Also, please make sure you have executed the BIA profiler functionality.
Tools > Data Management > Archetypes Mapper
Tools > Data Management > Weather Helper
Tools > Data Management > Surroundings Helper
Tools > Data Management > Terrain Helper
Tools > Demand Forecasting > Building Solar Radiation
Tools > Urban agriculture > BIA Profiler
Plot and visualise…
There are two steps in the method of plotting the planting calendars.
STEP 1 : Execute the BIA plotter…
You can execute the BIA plotter in two ways using CEA Dashboard or CEA command lines.
When using CEA Dashboard (see the screenshot below):
Tab multiprocessing: on or off as you need
Select your type of crops (please make sure that the crop types selected here do not exceed those you selected in the BIA profiler.)
Click Run Script
Now, please wait for a couple of minutes for the tool to complete the execution of BIA plotter.

Alternatively, you can use the CEA Command Lines:
Define all agriculture parameters in the file and save: /Users/your_name/cea.config
Open Mac Terminal :
Under documents/github/cityenergyanalyst : conda activate cea (For Windows, please open CEA console)
Type, then press return: cea bia-plotter
Depends on the size of your scenario, the BIA plotter may take a minute or two to finish the computation.
After executing the BIA plotter, now under > your_project > your_scenario > outputs > data > potentials > agriculture > plot, you should see all the output files that the BIA plotter has created. There are two types of output .csv files.
One type’s file name looks like this: building_name_BIA_crop_type.csv. Inside the file of each building, you can find the building’s BIA assessment results per floor (denoted as n_floor) per orientation (i.e., east, north, south and west) and the names of the corresponding building surfaces (denoted as srf_index). See details in the next section of this blog.
The second type’s file name looks like this: building_name_BIA_planting_calendar_crop_type.csv. The values inside such files measure the suitability of that floor and that orientation for growing that crop type. In addition, there is a file of planting calendar compiling all the crop types together (i.e., building_name_BIA_planting_calendar_all_crop_type.csv). The values inside this file measure the suitability of that floor and that orientation for growing all crop types you have selected for BIA profiler/plotter.
In Step 2, I am going to introduce how to plan calendar heatmaps to visualise these planting calendars, and in the next section of this blog, I am going to present the results and how to interpret them.
STEP 2 : Plot the planting calendar using Jupyter Notebook…
This step plots the planting calendar based on the second type of files created in the previous step. The tools used are Jupyter Notebook and calmap.
Please refer to this screenshot for the settings in Jupyter Notebook and see the results in the following section of this blog. For the documentation of Jupyter Notebook, please click here. For the documentation of calmap, please click here.

Understanding the results
Following the example above in Step 2 of the previous section, I have created the Cal-Heatmap as follows.
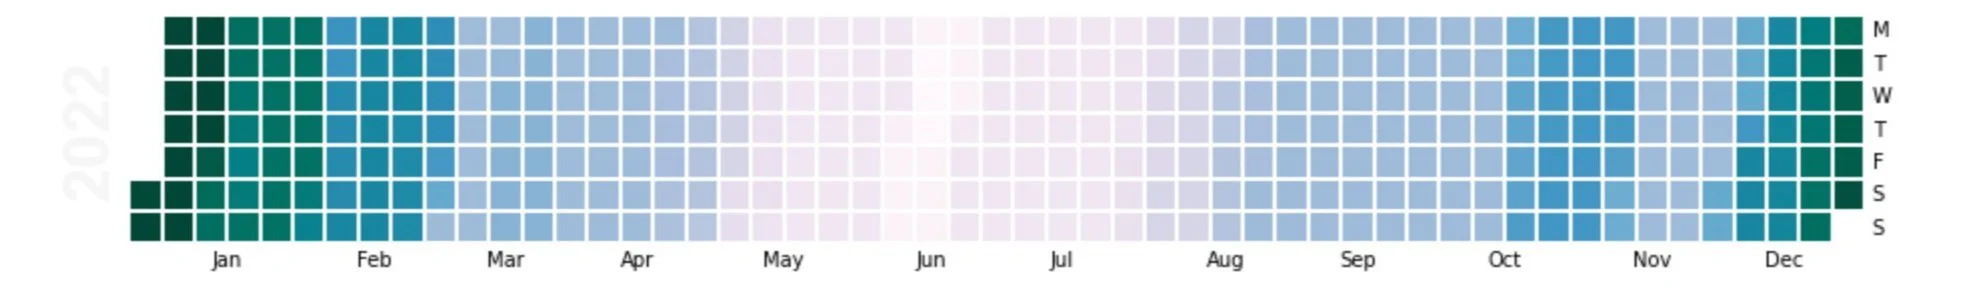
This Cal-Heatmap illustrates the suitability of growing Red Amaranth on the south-facing building surfaces of the ground floor of a residential building located near our laboratory in Singapore. From the heatmap, we can tell that it is more suitable to grow Red Amaranth on such building surfaces from late November till early March. This is because Singapore is located 1 degree north of the equator, and during this time, the south-facing building surfaces can receive abundant sunlight. The results are also sensitive to the surrounding contexts for shadings. Moreover, the suitability is, of course, related to the attributes of the selected crop type. The heatmap may present different patterns for a different building, a different floor, a different orientation or a different crop type.
The BIA metrics inside the BIA assessment result files (i.e., building_name_BIA_crop_type.csv.) are listed here.
yield_kg_per_sqm_surface_area_per_year :
[kg/m2/yr] crop yield per square metre of surface area over a year
ghg_kg_co2_per_sqm_bia :
[kg CO2-eq/m2/yr] greenhouse gas emissions per square metre of surface area over a year
ghg_kg_co2_per_sqm_saving :
greenhouse gas emission savings per square metre of surface area over a year compared to the same amount of crop produced in Malaysia and transported to Singapore
energy_kWh_per_sqm_bia :
[kWh/m2/yr] energy use per square metre of surface area over a year
energy_kWh_per_sqm_saving :
[kWh/m2/yr] energy use per square metre of surface area over a year compared to the same amount of crop produced in Malaysia and transported to Singapore
water_l_per_sqm_bia :
[litre/m2/yr] water use per square metre of surface area over a year
water_l_per_sqm_saving :
[litre/m2/yr] water use per square metre of surface area over a year compared to the same amount of crop produced in Malaysia and transported to Singapore
capex_per_sqm_USD:
[USD/m2] Initial capital investment per square metre of surface area
revenue_per_sqm_USD_per_year :
[USD/m2/yr] annual revenue per square metre of surface area if the amount of crops are sold at market price
net_revenue_per_sqm_USD_per_year :
[USD/m2/yr] annual revenue per square metre of surface area if the amount of crops are sold at market price less the operational expenditure, including seeds, pesticides, fertiliser and water
Please note: As of today, the BIA tool works the best for Singapore or its adjacent regions as the planting data have been acquired from the Tropical Technologies Laboratory affiliated to the National University of Singapore in Clementi, Singapore.
Next
In the next blog, it should finally be the one for me to introduce how you can customise and create your own crop type and add your own experimental data to the BIA tool.