GUIDEBOOK · CEA v4.0
Heat Rejection
Heat Rejection
Overview
Calculates the waste heat rejected to the environment by building energy systems and district plants. Heat rejection occurs when cooling systems (chillers, cooling towers) and heat pumps discharge excess heat to the ambient environment.
What It Calculates
Building-level heat rejection (kWh):
- Cooling system condenser heat (chiller waste heat)
- Boiler exhaust losses (fuel heating systems)
- Cooling tower processing (if configured)
Plant-level heat rejection (kWh):
- District cooling plant waste heat
- District heating plant exhaust losses
- Includes cooling tower effects where applicable
Prerequisites
- Final Energy completed for the what-if scenario
Key Parameters
| Parameter | Description |
|---|---|
| What-if name | Which final-energy scenario to calculate heat rejection for |
How to Use
-
Run Final Energy first
-
Run Heat Rejection:
- Navigate to Life Cycle Analysis
- Select Heat Rejection
- Select the what-if scenario
- Click Run
-
Processing time: Under 1 minute
Output Files
All outputs under {scenario}/outputs/data/analysis/{what-if-name}/heat/:
| File | Description |
|---|---|
heat_rejection_buildings.csv | Per-entity annual heat rejection summary |
heat_rejection_components.csv | Per-service component-level breakdown |
{entity_name}.csv | 8,760-row hourly heat rejection per entity |
Understanding Results
- Buildings with fuel-based heating reject heat through boiler exhaust losses
- Buildings with electric cooling reject condenser heat (demand + compressor work)
- District-connected buildings show zero heat rejection for DH/DC services; actual rejection appears on the plant row
- Plants typically show much larger heat rejection values since they serve many buildings
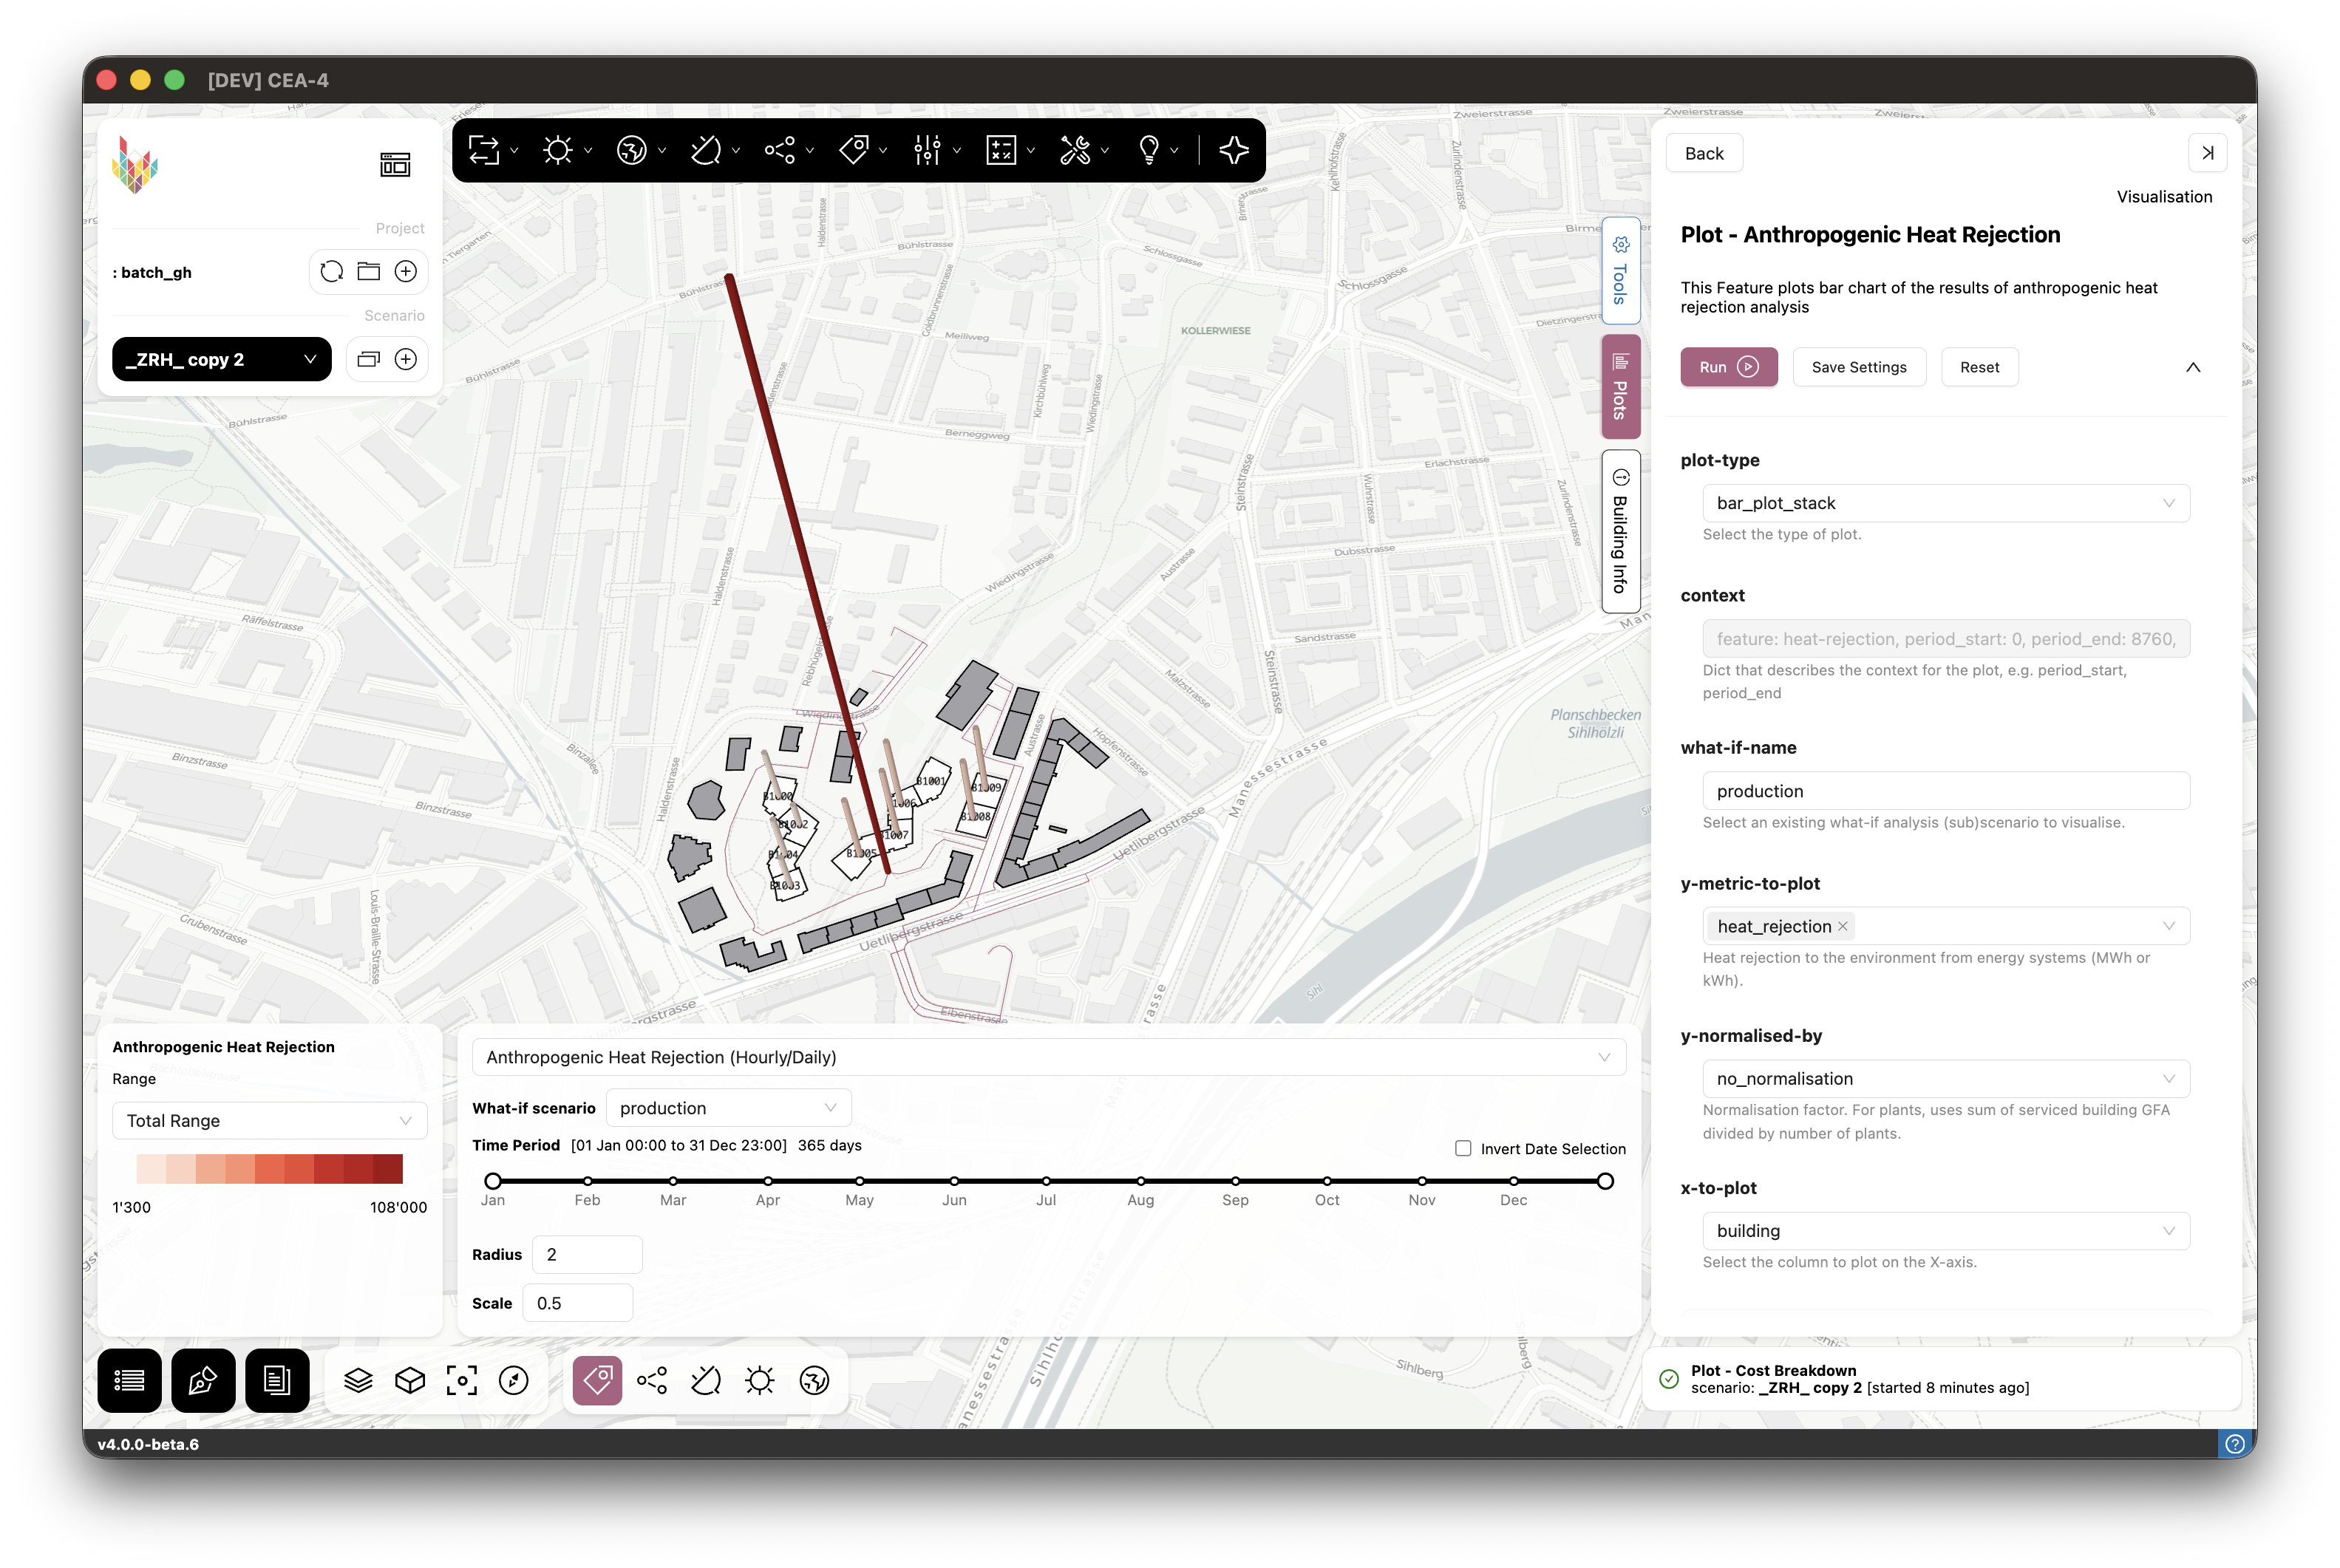
Map Layer
Heat rejection results are also available as a map layer in the dashboard, colour-coded by heat rejection magnitude per building. Useful for urban heat island assessment and spatial analysis.
Troubleshooting
| Issue | Solution |
|---|---|
| Zero heat rejection for a building | Building may use district services (heat rejection at plant level) or heat pumps (absorb ambient heat) |
| Very high plant heat rejection | Expected for DC plants — condenser must reject cooling load plus compressor work |
Plot - Heat Rejection
Overview
Creates bar charts of heat rejection per building and plant, showing the magnitude of waste heat discharged to the environment.
What It Shows
- Annual heat rejection per entity (buildings and plants)
- Plants typically show much larger values (serving multiple buildings)
- Plant names suffixed with
-DHor-DCto indicate network type
Example
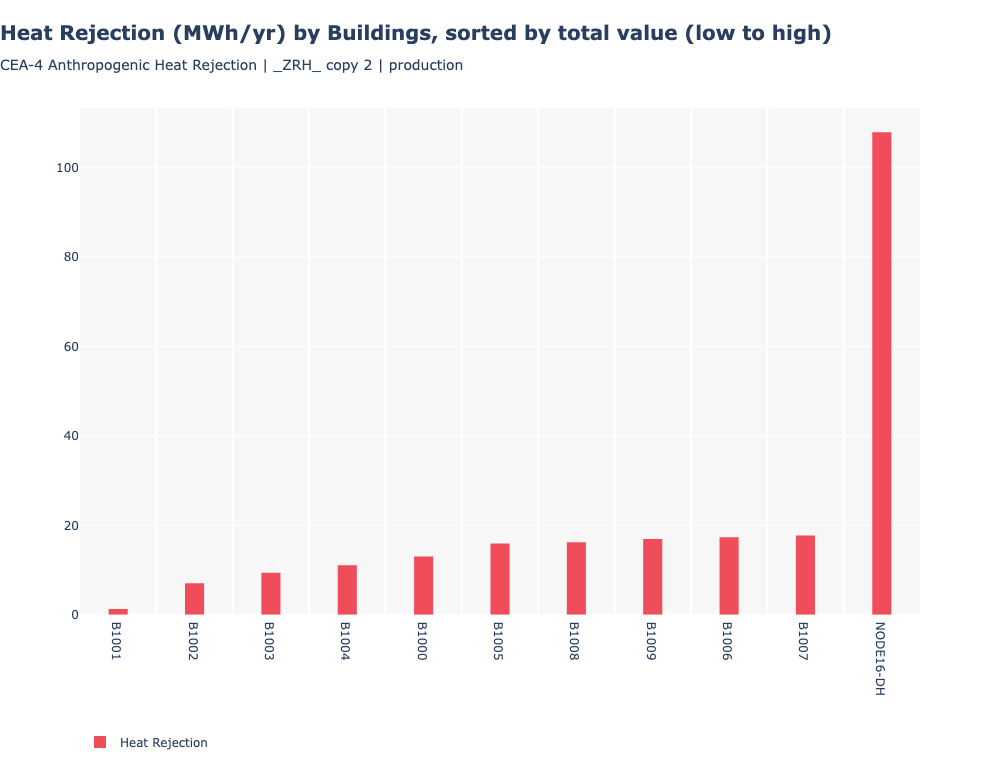
Heat rejection per building and district plant (NODE16-DH):
App map view showing anthropogenic heat rejection intensity per building and district heating plant:
Key Parameters
| Parameter | Description | Options |
|---|---|---|
| What-if name | Which scenario(s) to plot | Multi-select |
| Y unit | Energy unit | MWh, kWh, Wh |
| Normalise by | Normalisation | None, Gross floor area |
| X axis | View type | By building, by month, district hourly, etc. |
| Include | Entity filter | Buildings, Plants, or both |
Chart Interpretation
- Building bars show individual building waste heat
- Plant bars (with -DH/-DC suffix) show district-level waste heat
- Seasonal patterns (monthly/hourly views) correlate with cooling demand peaks
Use Cases
- Urban heat island assessment: Quantify waste heat contribution to local warming
- Heat recovery potential: Identify buildings/plants with large recoverable waste heat
- System comparison: Compare heat rejection across what-if scenarios
Related Features
- Final Energy - Prerequisite (provides system configuration)
- Emissions - Environmental emissions from the same scenario
- System Costs - Economic analysis of the same scenario
<- Back: System Costs | Back to Index | Next: Supply System Optimisation ->
Source: view raw on GitHub ↗