GUIDEBOOK · CEA v4.0
System Costs
System Costs
Overview
Calculates the capital (CAPEX) and operational (OPEX) costs for building energy supply systems under a specific what-if scenario. Uses the supply configuration and peak loads from the final-energy results to size equipment and calculate costs.
What It Calculates
Capital Costs (CAPEX):
- Equipment purchase based on peak capacity
- Annualised using equipment lifetime and interest rate
Operational Costs (OPEX):
- Fixed O&M as percentage of investment cost
- Variable energy costs per carrier
Total Annualised Cost (TAC):
- TAC = Annualised CAPEX + Fixed OPEX + Variable OPEX
Costs are calculated for building-scale systems, district plants (including pumping and piping), and solar installations.
Prerequisites
- Final Energy completed for the what-if scenario
- Cost database with component parameters
Key Parameters
| Parameter | Description |
|---|---|
| What-if name | Which final-energy scenario to calculate costs for |
How to Use
-
Run Final Energy first
-
Run System Costs:
- Navigate to Life Cycle Analysis
- Select System Costs
- Select the what-if scenario
- Click Run
-
Processing time: Under 1 minute for typical districts
Output Files
All outputs under {scenario}/outputs/data/analysis/{what-if-name}/costs/:
| File | Description |
|---|---|
costs_buildings.csv | Per-entity cost summary (one row per building/plant) |
costs_components.csv | Per-service component-level cost breakdown |
Understanding Results
- DISTRICT-scale buildings show zero costs at building level; their costs appear on the plant row
- Plant rows include conversion equipment, pumping, and piping costs
- Multi-component assemblies (e.g. chiller + cooling tower) produce multiple rows in
costs_components.csvfor the same service - Solar costs (PV/PVT/SC) are included if solar technologies are configured
Troubleshooting
| Issue | Solution |
|---|---|
| Costs seem too low/high | Check cost database is appropriate for your region; verify currency and units |
| Missing cost data | Update cost database with local costs; check component codes exist |
| Zero CAPEX for district buildings | Expected - DISTRICT-scale buildings have costs at the plant level |
| Plant piping costs missing | Ensure thermal-network Part 2 has been run |
Plot - Cost Sankey
Overview
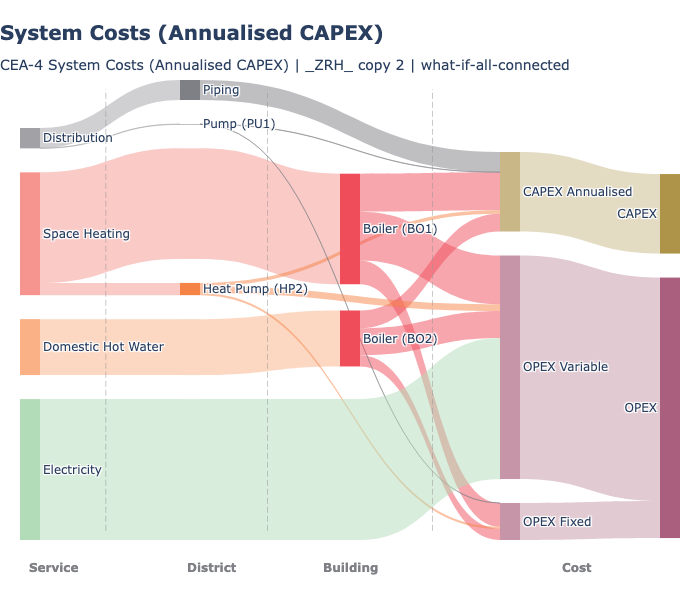
Creates a Sankey diagram showing cost flows from individual cost components through services to total building/district costs.
What It Shows
- Left side: Individual cost components (equipment, energy carriers)
- Middle: Cost categories (CAPEX, OPEX) by service
- Right side: Total cost per building or district
- Flow width proportional to cost magnitude
Key Parameters
| Parameter | Description | Options |
|---|---|---|
| What-if name | Which scenario to plot | Multi-select |
| CAPEX view | How to show capital costs | Annualised, Total |
| Cost categories | Which categories to include | CAPEX, OPEX, or both |
| Y unit | Currency unit | USD, kUSD, MUSD |
| Normalise by | Normalisation | None, Gross floor area |
Examples
Cost sankey showing flows from services through equipment to cost categories:
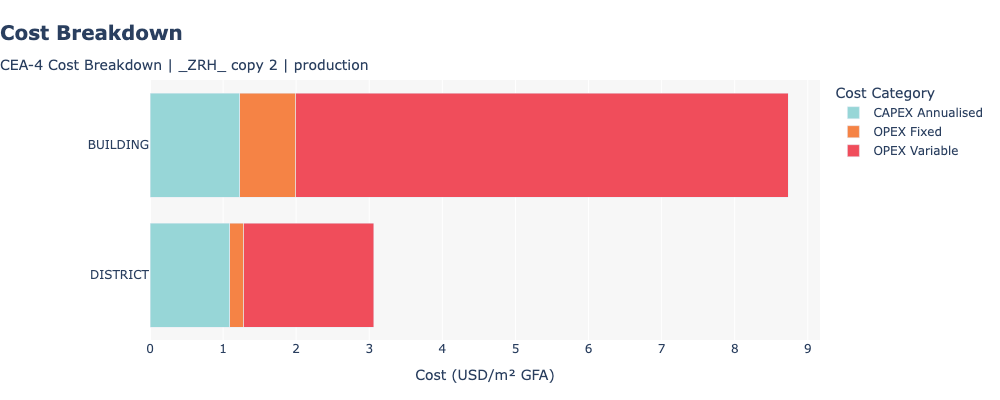
Cost breakdown comparing building-scale and district-scale costs per m2:
CAPEX View Options
- Annualised CAPEX: Shows annual equivalent cost (spread over equipment lifetime). Title: “System Costs (Annualised CAPEX)”.
- Total CAPEX: Shows full upfront investment cost. Title: “System Costs (Total CAPEX)”.
Chart Interpretation
- Wide flows = large cost items (focus here for cost reduction)
- CAPEX vs OPEX balance shows if costs are investment-heavy or operation-heavy
- Service breakdown shows which services drive costs
- Energy carrier costs in OPEX show fuel cost sensitivity
Related Features
- Final Energy - Prerequisite (provides supply configuration and peak loads)
- Emissions - Environmental analysis of the same scenario
- Heat Rejection - Environmental heat impact
<- Back: Emissions | Back to Index | Next: Heat Rejection ->
Source: view raw on GitHub ↗